What Color is the Ocean?
and why do you need satellites to tell you?
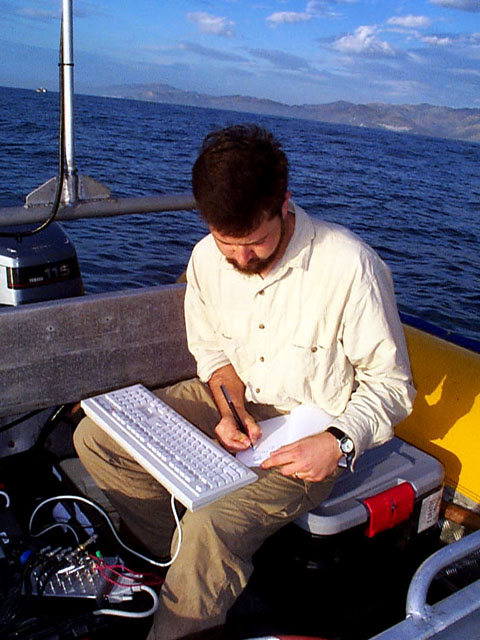
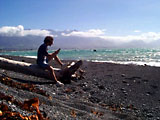 One of the things that I had hoped to do while on board the Kaharoa
during this expedition in addition to sitting in front of a computer screen
working on these webpages,
was to make measurements everyday around local noon with a little instrument
called a Sunphotometer. This thing is about the size of a gameboy and
more than once someone has yelled across the deck of a ship at me and said
"Hey Gene, quit playing games and get back to work!". However, since it looked
like I was not going to be able to spend any time at sea on board the Kaharoa,
I decided to take at least one measurement as close to the ocean as I
possibly could. Finding a nice, unobstructed part of the beach, I waited until
just the right moment and took what I hoped would be at least one
worthwhile set of observations.
One of the things that I had hoped to do while on board the Kaharoa
during this expedition in addition to sitting in front of a computer screen
working on these webpages,
was to make measurements everyday around local noon with a little instrument
called a Sunphotometer. This thing is about the size of a gameboy and
more than once someone has yelled across the deck of a ship at me and said
"Hey Gene, quit playing games and get back to work!". However, since it looked
like I was not going to be able to spend any time at sea on board the Kaharoa,
I decided to take at least one measurement as close to the ocean as I
possibly could. Finding a nice, unobstructed part of the beach, I waited until
just the right moment and took what I hoped would be at least one
worthwhile set of observations.
Well, let me explain what I am doing and
more importantly, why I am doing it. If someone were to ask you what
color the ocean is, chances are that your answer would be "blue". And for most
of the world's oceans, you would be right. However, wherever large numbers of
microscopic, floating algae called phytoplankton are found, the water
turns shades of green, red and brown. The more phytoplankton in the water, the
greener it is....the less phytoplankton, the bluer it is. Pretty simple.
But what we really want to know is "how much phytoplankton is there"? and also
"how does the distribution and abundance of phytoplankton change in time and
space?". There are many reasons why we should care about the answers to these
questions, and these along with some of the basic principles of remote sensing
(I'll be getting to that in a minute) can be found in the Teacher's
and Student's Guide at NASA's ocean color monitoring program called
SeaWiFS.
 Remote Sensing is simply observing
something from far away. In many ways, much of what Clyde and Bernard
will doing here on this expedition is remote sensing. When Clyde uses the
sonar on the Deep Rover, or when Bernard
listens to the sound of the
sperm whales with his hydrophones, that is
a form of remote sensing. What I do is to observe the earth from
space. In particular, I work on a project whose mission is to monitor ocean
color from space using a satellite called SeaStar that has just
one instrument on it, called SeaWiFS. Every day, SeaWiFS scans the
earth sending back nearly 2 gigabits of data which are processed to
produce spectacular images of the earth's vegetation, both in the
oceans and on land.
Remote Sensing is simply observing
something from far away. In many ways, much of what Clyde and Bernard
will doing here on this expedition is remote sensing. When Clyde uses the
sonar on the Deep Rover, or when Bernard
listens to the sound of the
sperm whales with his hydrophones, that is
a form of remote sensing. What I do is to observe the earth from
space. In particular, I work on a project whose mission is to monitor ocean
color from space using a satellite called SeaStar that has just
one instrument on it, called SeaWiFS. Every day, SeaWiFS scans the
earth sending back nearly 2 gigabits of data which are processed to
produce spectacular images of the earth's vegetation, both in the
oceans and on land.
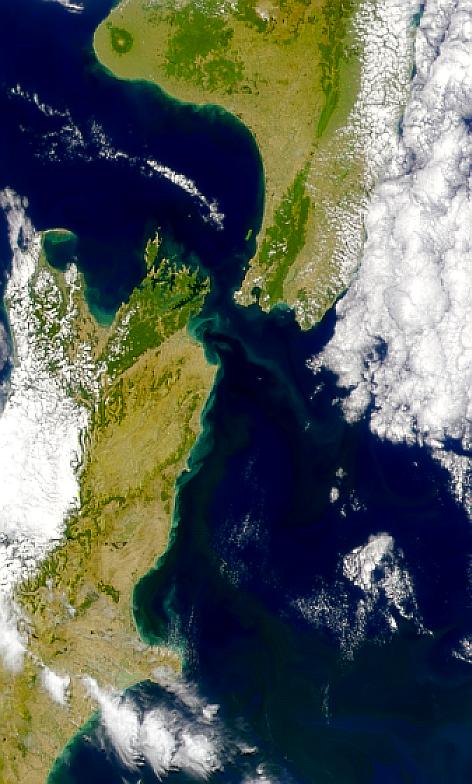
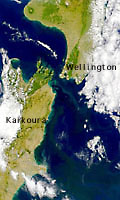 A little closer to home, the image on the right was taken by SeaWiFS
on February 21, 1999 and shows the land and ocean features of New
Zealand in much the same way as you would see them if you were
flying high above the earth.
Without getting into too much detail, in order to measure the effect of
phytoplankton on the color of the ocean, we need to measure the amount of
sunlight reflecting back from the earth after it has passed into the
ocean and been reflected back out to space. Remember what I said
earlier? The more phytoplankton in the water, the greener the light is
that comes back out of the ocean. However, before that light reaches
SeaWiFS which is flying overhead at 705 kilometers above the earth, it must pass
through the atmosphere. The atmosphere has a very great
effect on the light before it reaches the satellite and we must be able
to remove that effect before we can calculate the part of the light
that came out of the ocean. That is where my little sunphotometer come
in. I bet you thought I had forgotten all about it, didn't you?
A little closer to home, the image on the right was taken by SeaWiFS
on February 21, 1999 and shows the land and ocean features of New
Zealand in much the same way as you would see them if you were
flying high above the earth.
Without getting into too much detail, in order to measure the effect of
phytoplankton on the color of the ocean, we need to measure the amount of
sunlight reflecting back from the earth after it has passed into the
ocean and been reflected back out to space. Remember what I said
earlier? The more phytoplankton in the water, the greener the light is
that comes back out of the ocean. However, before that light reaches
SeaWiFS which is flying overhead at 705 kilometers above the earth, it must pass
through the atmosphere. The atmosphere has a very great
effect on the light before it reaches the satellite and we must be able
to remove that effect before we can calculate the part of the light
that came out of the ocean. That is where my little sunphotometer come
in. I bet you thought I had forgotten all about it, didn't you?
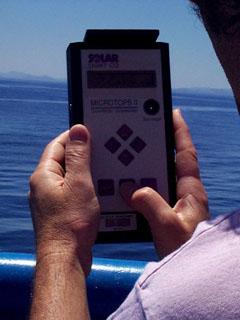
What I do is to point the sunphotometer at the sun at about the
same time that the satellite passes overhead (usually around local noon) and
measure the total amount of sunlight at very specific
wavelengths. These measurements are then used to help verify our
correction for the effect of the atmosphere on the SeaWiFS image take
at the same time. This process is called Ground Truth. Without
it, it would be very difficult to have very much confidence in our
satellite observations. Other researchers make measurements in the
water, both of the amount of light entering and leaving the ocean, and of the
concentrations of phytoplankton in the water.
 The measurements I make are very easy to do. All I do is:
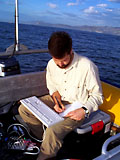
- find a nice, sunny spot on the ship I happen to be on (the bow is my
favorite spot)
- find something to brace myself against to avoid the effects
of the ship's rolling (which is one of the reasons that I didn't try taking any
measurements the other day when I went out with Bernard and Keith - the boat was
just a little too small)
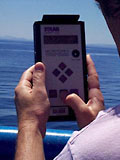
- enter some basic information from the little keypad such as time and location
- point the top of the sunphotometer at the sun and keep it centered in
the cross-hair target
- press the SCAN button and wait a few seconds for it to run
through all its measurements
I usually take ten measurements each day (scientists call
this taking replicate samples) to minimize the effect of a single, incorrect
sample. These measurements are then compared with the SeaWiFS
observations made at the same time and same location. This comparison
allows us to determine the accuracy of the algorithms (the computer programs
that we use to process the SeaWiFS data) and our understanding of how the
sensor might be changing over time.
The result of all this can be seen in the image above. This remarkable view of the
Global Biosphere, derived
from SeaWiFS data shows
the distribution of vegetation (plants and trees on land and microscopic
phytoplankton in the ocean) around the world. What we are doing now is
making maps like these every day to see how the earth's vegetation changes
from day to day, from season to season and soon, from year to year. By
monitoring these changes along with the processes that might be producing
the changes we observe, we will be in a much better position to be able to
predict how future changes in the earth's environment might influence life on
this planet.
 One of the things that I had hoped to do while on board the Kaharoa
during this expedition in addition to sitting in front of a computer screen
working on these webpages,
was to make measurements everyday around local noon with a little instrument
called a Sunphotometer. This thing is about the size of a gameboy and
more than once someone has yelled across the deck of a ship at me and said
"Hey Gene, quit playing games and get back to work!". However, since it looked
like I was not going to be able to spend any time at sea on board the Kaharoa,
I decided to take at least one measurement as close to the ocean as I
possibly could. Finding a nice, unobstructed part of the beach, I waited until
just the right moment and took what I hoped would be at least one
worthwhile set of observations.
One of the things that I had hoped to do while on board the Kaharoa
during this expedition in addition to sitting in front of a computer screen
working on these webpages,
was to make measurements everyday around local noon with a little instrument
called a Sunphotometer. This thing is about the size of a gameboy and
more than once someone has yelled across the deck of a ship at me and said
"Hey Gene, quit playing games and get back to work!". However, since it looked
like I was not going to be able to spend any time at sea on board the Kaharoa,
I decided to take at least one measurement as close to the ocean as I
possibly could. Finding a nice, unobstructed part of the beach, I waited until
just the right moment and took what I hoped would be at least one
worthwhile set of observations.